
Ensuring Data Integrity: How Major Databases Handle Partial Writes and Atomic Operations
2024-05-30In the world of databases, ensuring atomicity in write operations is crucial. This post explores the importance of atomic writes and how various databases handle potential issues like partial writes.
Understanding Partial Writes
In the I/O write chain, the size of atomic operations can vary. An operation at a higher level may be split into multiple operations at a lower level, leading to scenarios where some operations succeed while others fail. This phenomenon is known as a partial write.
- Legacy Disk Drives: Default sector size is 512 bytes.
- Modern Disk Drives: Advanced format sector size is 4k.
- Filesystem Page Size: For example, ext4 has a default page size of 4k.
- Database Page Sizes:
- Oracle: 8K
- MySQL: 16K
- PostgreSQL: 8K
- openGauss: 8K
The Reality of Partial Writes
While theoretically, databases must handle partial writes, in practice, such events are quite rare. The critical aspect is not just preventing partial writes but ensuring robust mechanisms for data integrity checks (checksums) and recovery when issues do arise.
How Oracle Handles Partial Writes
Oracle’s approach to partial writes is pragmatic:
- Automatic Repair: If a fractured block is detected, Oracle tries to repair it using the corresponding block from Active Data Guard (ADG) or the flashback log.
- Error Reporting: If automatic repair fails, an ORA-01578 error is logged, prompting the DBA to perform a media recovery.
- Block-Level Recovery: Oracle supports block-level recovery, making the process less cumbersome and time-consuming.
Oracle’s backup sets are designed to handle partial writes:
- Using OS Commands: When backing up data files using OS commands, Oracle requires the tablespace to be in backup mode. Any changes to data blocks are logged in the redo log, ensuring a clean block can be restored during recovery.
- Using RMAN: RMAN handles partial writes by ensuring that each backup block is clean, eliminating the need to worry about fractured blocks.
- Block Checking: Oracle provides mechanisms like DB_BLOCK_CHECKING for comprehensive checksums.
How MySQL Handles Partial Writes
MySQL employs a double write buffer to safeguard against partial writes.
- Double Write Buffer: Despite its name, the double write buffer is not stored in memory; instead, it consists of persistent files on disk. The mechanism works as follows: before writing a data block to its final location on disk, MySQL first writes it to the double write buffer.
- Data Integrity: This approach ensures that there is always a clean copy of the block available—either in the double write buffer or in the data files—allowing for safe redo operations.
However, this method is not without its challenges. One of the primary concerns is its efficiency, as it effectively doubles the I/O workload for redo logging. This has sparked ongoing discussions about the trade-offs and effectiveness of using a double write buffer to address partial writes.
How PostgreSQL Handles Partial Writes
PostgreSQL employs full page writes to manage partial writes effectively:
- Full Page Writes: When a data block is updated for the first time after a checkpoint, the entire block is written to the WAL (Write-Ahead Logging) log. This is akin to the database always being in “Backup status,” similar to issuing the
alter tablespace x begin backupcommand in an Oracle database. - Data Integrity: This mechanism ensures that even if a partial write occurs, the database remains consistent because the original page can be used for redo operations.
There has been community discussion about adopting a double write buffer mechanism, but it remains an area of interest rather than active development. For more details, you can check out these discussions:
- Discussion on Double Write Buffer Mechanism (Post 1)
- Discussion on Double Write Buffer Mechanism (Post 2)
How MogDB Handles Partial Writes
MogDB (the enterprise edition of openGauss) combines strategies from MySQL and PostgreSQL:
- Double Write Buffer: Similar to MySQL, MogDB uses a double write buffer by setting
enable_double_write=on. - Full Page Writes: MogDB retains PostgreSQL’s full page write mechanism by setting
full_page_writes=on.
Depending on the configuration of incremental checkpoints (enable_incremental_checkpoint):
- Incremental Checkpoints Off:
- With
full_page_writes=on, full page writes are used. - With
full_page_writes=off, partial writes are not a concern.
- With
- Incremental Checkpoints On:
- With
enable_double_write=on, double writes are used. - With
enable_double_write=off, the behavior depends on full_page_writes settings.
- With
Conclusion
Ensuring atomic writes in databases is essential for data integrity and consistency. While partial writes are rare, robust mechanisms for detection and recovery are vital. Oracle, MySQL, PostgreSQL, and MogDB/openGauss each have unique approaches to handling these scenarios, ensuring that data remains reliable and recoverable.
How to build blog site by using Hexo in Windows WSL and deploy to GitHub Pages
2024-05-27Why use WSL
Using Windows Subsystem for Linux (WSL) instead of relying solely on Windows can offer several advantages, particularly for developers and IT professionals. WSL allows users to run a GNU/Linux environment directly on Windows, without the overhead of a traditional virtual machine or dual-boot setup. This enables seamless access to a wide range of Linux tools and utilities, which are often preferred for development tasks, scripting, and system administration. Additionally, WSL provides a more consistent and familiar environment for those accustomed to Unix-based systems, facilitating smoother workflows and integration with cloud-based services. By leveraging WSL, professionals can enjoy the best of both worlds: the robust software ecosystem of Windows and the powerful command-line capabilities of Linux.
Why use Hexo
Hexo offers several advantages over WordPress, particularly for developers and tech-savvy users. As a static site generator, Hexo provides faster load times and improved security since it does not rely on a database or server-side processing, which are common vulnerabilities in WordPress. Additionally, Hexo allows for greater customization through its use of Markdown and extensive plugin ecosystem, enabling users to tailor their sites to specific needs without the overhead of a complex content management system. Furthermore, Hexo’s deployment process is streamlined, often integrating seamlessly with version control systems like Git, making it an excellent choice for those who prioritize efficiency and performance in their web development projects.
Why use Github Pages
Using GitHub Pages instead of a traditional hosting server offers several distinct advantages. Firstly, GitHub Pages provides a seamless integration with GitHub repositories, enabling automatic deployment of websites directly from your codebase. This integration ensures that updates and changes to your site are effortlessly managed through version control, promoting a streamlined workflow. Additionally, GitHub Pages is cost-effective, offering free hosting with custom domain support, which can significantly reduce overhead costs for personal projects or small businesses. The platform also boasts robust security features, leveraging GitHub’s infrastructure to protect your site from common vulnerabilities. Furthermore, the simplicity and ease of use make GitHub Pages an attractive option for developers who want to focus on writing code rather than managing server configurations and maintenance. Overall, GitHub Pages combines efficiency, cost savings, and security, making it an excellent choice for hosting static websites and project documentation.
GO!
Assume already has a WSL environment running
If not, refer to “How to install Linux on Windows with WSL“.
To say we are running WSL distro - Ubuntu 22.04
1 | $ cat /etc/os-release |
Install Node.js
Since Hexo is written by Node.js, nodejs must be installed.
1 | sudo apt update |
Install GIT
Since Hexo uses Git to publish pages on GitHub, Git must be installed.
1 | sudo apt install git |
Install Hexo
1 | sudo npm install -g hexo-cli |
Init Hexo project
Our goal is to deploy the static HTML file generated by Hexo to GitHub Pages. To achieve this, we need to create a repository named “[username].github.io” on GitHub. Therefore, we will initialize this directory directly using Hexo. Note: Be sure to replace [username] with your actual GitHub username.
1 | hexo init kamusis.github.io |
Create Github pages
Creating GitHub Pages is very simple, reference: https://pages.github.com/
Connecting to Github with SSH
Reference: https://docs.github.com/en/authentication/connecting-to-github-with-ssh
Basically, generate a key using the ssh-keygen command and upload the public key to the GitHub.
Once the SSH connection is established, use the following command to verify it:
1 | $ ssh -T git@github.com |
Set URL for your new blog
1 | $ vi _config.yml |
Set Git information to let hexo can push contents into Github Pages
1 | $ npm install hexo-deployer-git --save |
Generate the site and push to Github pages
1 | $ hexo clean |
Assuming everything has been set up correctly, you can now view a hello-world article on a website by navigating to https://[username].github.io.
Write your articles and publish
1 | hexo new "My first post" |
A markdown file will automatically be created and placed in the source/_posts directory. It can then be edited and saved using your preferred text or markdown editor.
Of course, you can also clean up the initial hello-world article.
1 | rm source/_posts/hello-world.md |
Publish the articles.
1 | $ hexo clean |
Reference:
https://hexo.io/docs/github-pages#One-command-deployment
https://gist.github.com/btfak/18938572f5df000ebe06fbd1872e4e39
How to Find the Corresponding Session in MogDB/openGauss from OS Thread ID
2024-05-27Diagnostic Needs
When the MogDB database consumes a significant amount of system resources, such as nearly 100% CPU usage, how can we determine which session(s) in the database are using these resources?
In Oracle databases, diagnosing such issues typically involves associating v$session, v$process, and the OS process ID found using the top or ps commands. However, MogDB uses a thread model, and only one process ID is visible at the OS level. So, how do we pinpoint the problem?
Since MogDB uses a thread model, unlike PostgreSQL’s process model, checking network port access with the lsof command at the OS level will show multiple user sessions connected, but only the process ID will be displayed in the PID column, not the thread.
1 | lsof -i 4 -a -p `pgrep -u omm3 mogdb` |
How to Get Thread ID
You can use htop. After opening htop, press F5 to display the process tree. The first PID is the process ID, and each line under the tree structure shows the corresponding thread ID for that process.
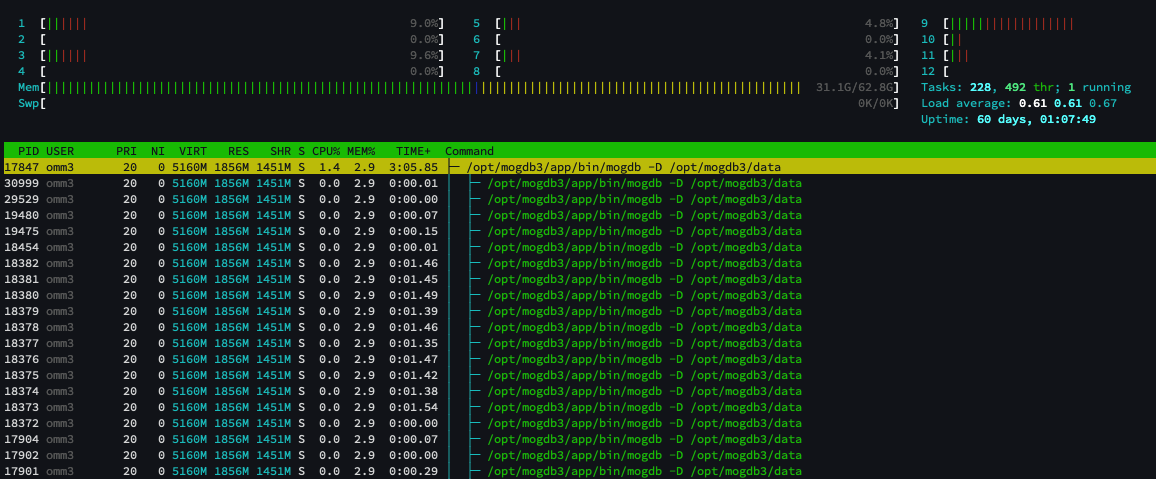
You can also use the ps command. The -L parameter displays threads, and the -o parameter specifies the columns of interest.
1 | ps -Lp `pgrep -u omm3 mogdb` -o %cpu,tid,pid,ppid,cmd,comm |
The rows in the comm column that display as “worker” are backend processes of user sessions in the database. Typically, user sessions that consume high CPU can be filtered to show only user sessions using the grep command.
How to Map OS Thread ID to Database Session
Suppose on this server, the thread with ID 18372 is consuming a lot of CPU. In MogDB, you can query the pg_os_threads view to find the session ID corresponding to this thread.
1 | MogDB=# select * from pg_os_threads where lwpid=18372; |
The pg_os_threads view records the relationship between lightweight thread IDs and session IDs. The lwpid column is the OS thread ID, and the pid column is the database session ID. For detailed information, refer to the MogDB documentation on PG_OS_THREADS.
If you have monadmin privileges, you can also query the os_threads view in the dbe_perf schema, which provides the same information.
After finding the database session ID, you can perform various actions, such as querying the dbe_perf.session_stat_activity view to get the application name, client IP address, and the SQL query being executed by that session.
1 | MogDB=# select application_name, client_addr, query from dbe_perf.session_stat_activity where pid=140545137571584; |
You can also query the dbe_perf.thread_wait_status view to get the current wait event of the session. Note that this view contains the lwtid field, which directly corresponds to the thread ID.
1 | MogDB=# select lwtid, wait_status, wait_event from dbe_perf.thread_wait_status where sessionid=140545137571584; |
MogDB ASH: Unveiling the Active Session History for Powerful Database Performance Tuning
2024-05-27What is ASH?
ASH, or Active Session History, is a feature in Oracle databases that records information about active sessions at regular intervals in both the database memory and persistent system tables. Data in memory is cleared after a database restart, but data in the persistent system tables is retained for a longer period. ASH is extremely useful for diagnosing issues when the database encounters problems or performance issues by allowing retrospective analysis to identify the root cause.
In MogDB, a similar ASH capability is implemented.
ASH Capability in MogDB
The ASH capability in MogDB is divided into two parts: the open-source community version (openGauss) and the enhanced enterprise version.
1. openGauss Community Version:
MogDB inherits the ASH capability from openGauss. The database provides two main views: dbe_perf.LOCAL_ACTIVE_SESSION and GS_ASP. The LOCAL_ACTIVE_SESSION view is an in-memory table, while GS_ASP is a persistent table. These views contain sampling information about current active sessions.
Key parameters affecting ASH functionality:
- enable_asp: Set to
onoroffto enable or disable ASH functionality. Default ison. - asp_sample_interval: Specifies the interval between each sample. Default is 1 second. To reduce sampling pressure, this can be set to a longer interval, up to a maximum of 10 seconds.
- asp_sample_num: Specifies the total number of samples retained in the
LOCAL_ACTIVE_SESSIONin-memory table. Exceeding this number triggers a flush of in-memory samples to theGS_ASPsystem table and clears the in-memory table. Default is 100,000 samples. - asp_flush_rate: Determines which in-memory samples are flushed to the
GS_ASPtable. Samples withsampleid % asp_flush_rate == 0are marked asneed_flush_sample=trueand are persisted. Default is 10, meaning 1/10 of samples are persisted. - asp_retention_days: Specifies the retention period for data in the
GS_ASPtable. Default is 2 days, with a maximum of 7 days.
2. MogDB Enterprise Version:
The enterprise version enhances ASH capability, termed “SQL Execution State Observation,” by adding sampling of SQL execution operators. The plan_node_id field is added to views to record the execution operator during each sample, allowing identification of which step in the execution plan is causing performance issues.
Key parameters affecting enterprise ASH functionality:
- resource_track_level: Set to
operatorto enable operator sampling capability. Default isquery, which records only SQL-level sampling.
LOCAL_ACTIVE_SESSION View
This view records extensive information, including session ID, wait events, and SQL query ID (which can be linked to dbe_perf.statement_history or dbe_perf.statement_complex_runtime to retrieve SQL text and execution plans).
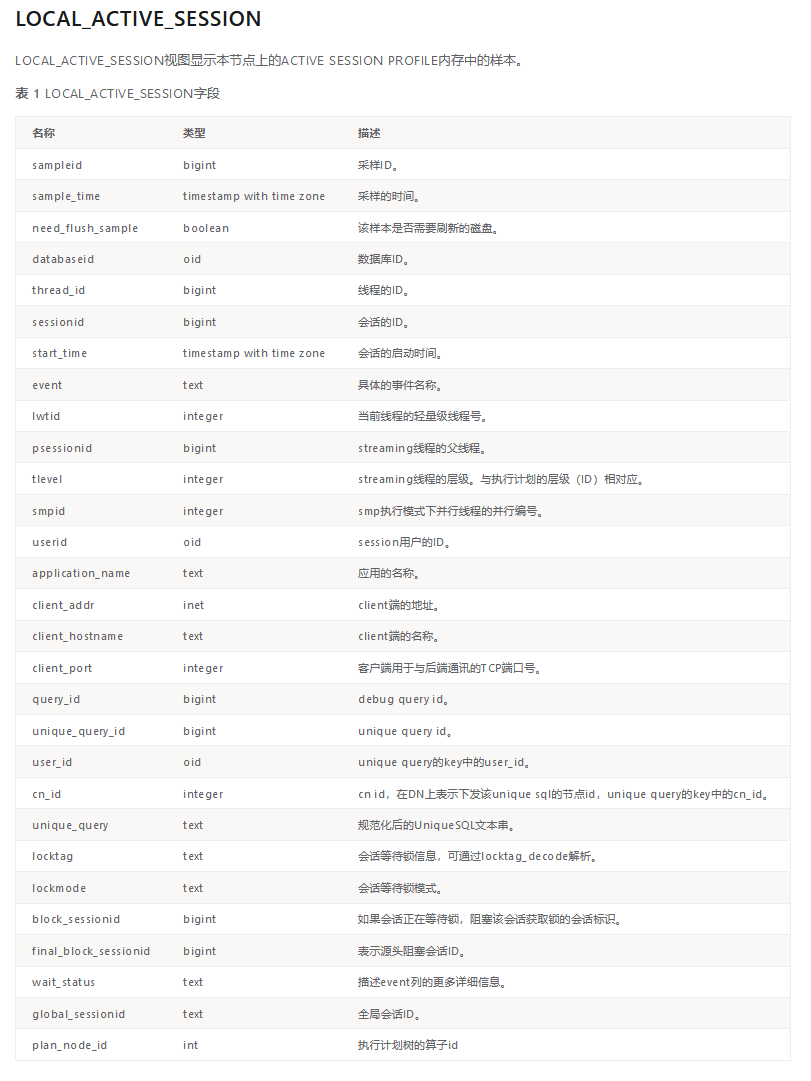
Note: The plan_node_id field exists only in the enterprise version.
Recording SQL Execution Plans
Querying the execution plans of past or currently executing SQL is a common requirement in database maintenance. In MogDB, the following views record SQL execution plans:
- dbe_perf.STATEMENT_HISTORY: Records information about completed SQL, including execution plans (
query_planfield). - dbe_perf.STATEMENT_COMPLEX_RUNTIME: Records information about currently executing SQL, including execution plans (
query_planfield).
Parameters affecting recording of SQL execution plans:
- enable_resource_track: Enables or disables resource tracking. Default is
on. If set tooff, no user SQL execution information, including execution plans, is tracked. - resource_track_cost: Sets the minimum execution cost for SQL statements to be tracked. Only SQL with a cost above this value will have its execution plan recorded.
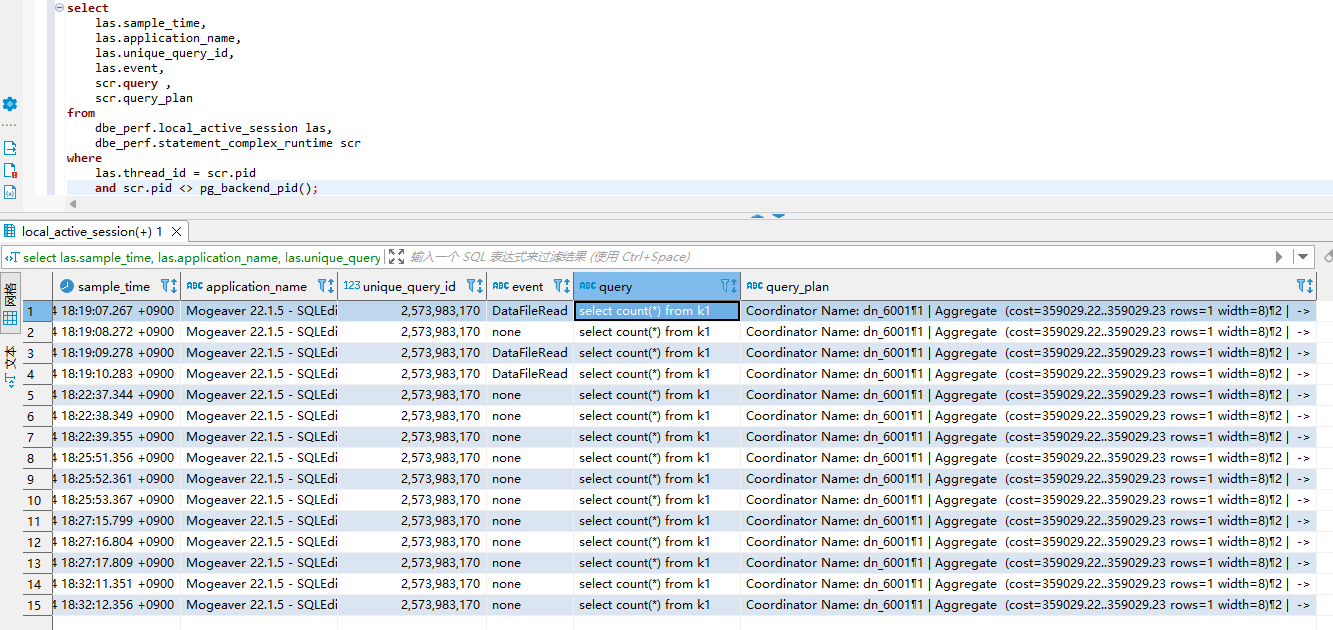
Comprehensive Query Example
The following query retrieves all information about ongoing SQL executions, including historical samples:
1 | SELECT las.sample_time, las.application_name, las.unique_query_id, las.event, scr.query, scr.query_plan |
Example output shows a frequently executed full table scan query, including SQL text, execution plan, and client information, providing valuable data for performance diagnosis.
How to move WSL distro in Windows 11 to another drive
2024-05-27Introduction:
In the world of development and system administration, Windows Subsystem for Linux (WSL) has become a valuable tool. It allows users to run a Linux distribution alongside their Windows environment, opening up a world of possibilities for developers and administrators. In this article, we’ll guide you through the process of migrating a WSL instance, using a real-world example, step by step.
Prerequisites:
Before we begin, ensure that you have the following prerequisites in place:
- Windows 10 or later with WSL installed.
- An existing WSL instance (in our case, Ubuntu).
- Sufficient storage space for the migration.
Step 1: Create a Target Directory
To start the migration process, we need a target directory to store the migrated WSL instance. In PowerShell, use the ‘mkdir’ command to create this directory. In our example, we create a directory named ‘D:\WSL\Ubuntu’:
1 | mkdir -p D:\WSL\Ubuntu |
Step 2: List All Running WSL Instances
Before we proceed further, let’s list all the running WSL instances. The following command will display a list of all WSL instances, including their state and version:
1 | wsl -l --all -v |
Step 3: Export the Source WSL Instance
Now, let’s export the source WSL instance (in our case, ‘Ubuntu’) into a tar file. This step automatically shuts down the WSL instance and restarts it after the export:
1 | wsl --export Ubuntu D:\WSL\Ubuntu.tar |
Step 4: Unregister the Source WSL Instance
Once the export is complete, we need to unregister the source WSL instance to avoid conflicts. Use the following command:
1 | wsl --unregister Ubuntu |
Step 5: Confirm Unregistration
To confirm that the source WSL instance has been successfully unregistered, run the following command:
1 | wsl -l --all -v |
Step 6: Import into the Target Directory
Now it’s time to import the previously exported WSL instance into the target directory. In this step, we specify the target directory and version (in our case, version 2):
1 | wsl --import Ubuntu D:\WSL\Ubuntu D:\WSL\Ubuntu.tar --version 2 |
Step 7: Verify the Migration
To ensure that the migration was successful, list all WSL instances once again:
1 | wsl -l --all -v |
Step 8: Access the Migrated WSL Instance
Now, you can access the migrated WSL instance by using the following command:
1 | wsl -d Ubuntu |
Conclusion:
Migrating WSL instances is a powerful way to manage and organize your development environments. By following these steps, you can seamlessly move your WSL instances to different directories or machines, ensuring flexibility and efficiency in your development workflow. Keep in mind that WSL provides a bridge between Windows and Linux, allowing you to enjoy the best of both worlds.
Check the all steps screenshot as below.
1 | # create target directory |
Unlocking the Power: Key Features of MogDB
2024-05-27Introduction to MogDB
MogDB is a cutting-edge distributed relational database management system that offers an array of powerful features designed to meet the needs of modern businesses. With its high performance, availability, maintainability, compatibility, and AI capabilities, MogDB stands out as a top choice for database administrators, developers, and IT professionals.
One of the key selling points of MogDB is its ability to deliver exceptional performance. This is achieved through various innovative features such as the Cost-Based Optimizer (CBO) optimizer, which intelligently chooses the most efficient execution plans for queries. Additionally, MogDB utilizes a vectorized engine that processes data in batches instead of row by row, resulting in significant performance improvements. The adaptive compression feature further enhances performance by reducing storage requirements and minimizing I/O operations.
In terms of availability, MogDB offers robust solutions to ensure uninterrupted access to critical data. It supports master-slave replication, allowing for automatic failover in case of primary node failure. Logical replication enables real-time data synchronization across multiple databases, while physical backup provides reliable data protection. Delayed replay allows for easy recovery from accidental data corruption or deletion.
Maintaining a database can be complex and time-consuming. However, MogDB simplifies this process with its advanced maintainability features. The grey upgrade feature allows for seamless upgrades without interrupting service availability. Slow SQL diagnosis helps identify and optimize poorly performing queries, improving overall system efficiency. System KPI diagnosis provides insights into system health and performance metrics, enabling proactive maintenance and troubleshooting. Fault diagnosis helps pinpoint issues quickly and accurately.
Compatibility is another area where MogDB excels. It supports various SQL features and ensures compatibility with popular database systems such as Oracle and MySQL. This makes it easier for organizations to migrate their existing applications or leverage their existing SQL knowledge without major modifications.
MogDB also boasts impressive AI capabilities that set it apart from traditional databases. The AI4DB feature enables autonomous database operations, automating routine tasks and optimizing performance based on machine learning algorithms. DB4AI allows for database-driven AI, empowering organizations to leverage their data for advanced analytics and machine learning applications. Additionally, the ABO optimizer intelligently adapts query execution plans based on real-time data statistics, further enhancing performance.
High Performance Features
MogDB is designed to deliver exceptional performance, ensuring that your database operations run smoothly and efficiently. With its cutting-edge features, MogDB offers unparalleled speed and optimization capabilities.
One of the key high-performance features of MogDB is the Cost-Based Optimizer (CBO). This optimizer leverages advanced algorithms and statistical models to determine the most efficient execution plan for queries. By analyzing query statistics and data distribution, the CBO can make intelligent decisions on how to execute queries in the most optimal way. This results in faster query processing times and improved overall performance.
In addition to the CBO optimizer, MogDB also utilizes a vectorized engine. This engine takes advantage of modern CPU architectures by performing operations on entire vectors of data at once, rather than processing individual elements sequentially. As a result, complex queries that involve large datasets can be executed more quickly and efficiently.
Another feature that contributes to MogDB’s high performance is adaptive compression. This feature dynamically adjusts the level of compression applied to data based on its characteristics and usage patterns. By compressing data when it is not actively being accessed or modified, MogDB can reduce storage requirements and improve I/O performance. When data needs to be accessed or modified, it is decompressed on-the-fly for seamless operations.
Parallel query optimization is yet another powerful feature offered by MogDB. This feature allows queries to be divided into smaller tasks that can be executed simultaneously across multiple cores or nodes in a distributed environment. By leveraging parallelism, MogDB can significantly speed up query processing times for large datasets or complex queries.
With these high-performance features combined, MogDB ensures that your database operations are lightning-fast and efficient. Whether you’re running simple CRUD operations or complex analytical queries, you can rely on MogDB to deliver exceptional performance every time.
It’s worth noting that while these high-performance features greatly enhance the speed and efficiency of MogDB, they do not compromise on data integrity or reliability. MogDB is built with a strong focus on ACID (Atomicity, Consistency, Isolation, Durability) principles, ensuring that your data remains consistent and reliable even under high-performance workloads.
High Availability Features
Ensuring high availability is crucial for any database management system, and MogDB excels in this aspect with its robust set of features. Let’s dive into the key high availability features that make MogDB a reliable choice for businesses.
Master-slave replication for data redundancy
MogDB offers master-slave replication, a powerful feature that enhances data redundancy and fault tolerance. With this feature, changes made to the master node are automatically replicated to one or more slave nodes. In the event of a failure or outage on the master node, one of the slave nodes can seamlessly take over as the new master, ensuring uninterrupted service availability. This replication mechanism not only provides data redundancy but also improves read scalability by allowing read operations to be distributed across multiple nodes.
Logical replication for real-time data synchronization
In addition to master-slave replication, MogDB supports logical replication, enabling real-time data synchronization between databases. This feature allows specific tables or even subsets of tables to be replicated from one database instance to another. By capturing and propagating changes at the logical level rather than replicating entire physical blocks, logical replication minimizes network traffic and reduces latency. It enables businesses to maintain up-to-date replicas of their databases for reporting purposes or offloading read-intensive workloads without impacting the performance of the primary database.
Physical backup for data protection
Data protection is paramount in any database system, and MogDB addresses this need through its physical backup feature. With physical backups, administrators can create full copies of their databases at a specific point in time. These backups capture both the schema and data files, ensuring comprehensive recovery options in case of hardware failures, user errors, or other catastrophic events. MogDB’s physical backup mechanism provides flexibility by allowing backups to be stored on different storage devices or even transferred to remote locations for disaster recovery purposes.
Delayed replay for data recovery
MogDB includes a delayed replay feature that allows administrators to recover data from a specific point in time. This feature is particularly useful in scenarios where accidental data deletions or modifications occur and need to be rolled back. By leveraging the transaction log, MogDB can replay changes up until a certain point, effectively restoring the database to its state prior to the incident. The delayed replay feature provides an additional layer of protection against human errors or malicious activities, ensuring that businesses can quickly recover from data-related incidents.
In summary, MogDB offers a comprehensive set of high availability features that guarantee reliability and continuous operation for businesses. The master-slave replication ensures data redundancy and read scalability, while logical replication enables real-time data synchronization for reporting or offloading purposes. Physical backups and delayed replay provide robust data protection mechanisms, allowing administrators to recover from hardware failures or user errors effectively. With these high availability features, MogDB empowers organizations with the confidence that their critical databases will remain accessible and resilient even in the face of unexpected challenges.
*[E-A-T]: Expertise, Authoritativeness, Trustworthiness
Maintainability Features
Maintainability is a crucial aspect of any database management system, and MogDB excels in this area with its array of innovative features. These features are designed to ensure seamless system updates, optimize performance, monitor and analyze system KPIs, and resolve any potential faults. Let’s explore these maintainability features in detail.
One of the standout maintainability features of MogDB is the grey upgrade capability. This feature allows for seamless system updates without interrupting ongoing operations. With grey upgrade, administrators can apply patches, upgrades, or even major version changes to MogDB without causing downtime or disrupting user access. This ensures that businesses can keep their databases up-to-date with the latest enhancements and security fixes while minimizing any potential disruptions to their operations.
Another essential maintainability feature offered by MogDB is slow SQL diagnosis. Slow SQL queries can significantly impact database performance and user experience. MogDB addresses this issue by providing comprehensive tools for identifying and optimizing slow SQL queries. The system analyzes query execution plans, identifies bottlenecks, and suggests optimizations to improve query performance. By pinpointing problematic queries and optimizing them, administrators can enhance overall database performance and ensure smooth operation.
System KPI diagnosis is another vital component of MogDB’s maintainability arsenal. Monitoring key performance indicators (KPIs) is crucial for understanding the health and efficiency of a database system. MogDB provides robust tools for monitoring and analyzing various KPIs such as CPU utilization, memory usage, disk I/O, network traffic, and more. Administrators can set up custom alerts based on predefined thresholds to proactively identify any anomalies or potential issues before they impact the system’s performance or availability.
In addition to diagnosing slow SQL queries and monitoring KPIs, MogDB also offers fault diagnosis capabilities. When an issue arises within the database system, it is essential to quickly identify the root cause and resolve it efficiently. MogDB provides advanced diagnostic tools that help administrators identify and troubleshoot various types of faults, including hardware failures, network issues, software bugs, or configuration problems. By quickly identifying and resolving faults, administrators can minimize downtime and ensure the continuous availability of their database system.
Compatibility Features
MogDB offers a wide range of compatibility features that make it a versatile and flexible choice for database administrators, developers, and IT professionals. One of the key compatibility features is its support for various SQL features. With MogDB, you can leverage the full power of SQL and take advantage of advanced querying capabilities to meet your specific business needs.
In addition to its support for SQL features, MogDB also provides seamless compatibility with Oracle databases. This compatibility feature allows for easy migration from Oracle to MogDB without any major disruptions or changes to your existing applications. The transition process is smooth and hassle-free, ensuring that you can quickly start benefiting from the high-performance and highly available nature of MogDB.
Another compatibility feature offered by MogDB is its support for MySQL databases. This means that you can seamlessly integrate MogDB into your existing MySQL infrastructure without any major modifications. Whether you are running applications that rely on MySQL or have data stored in MySQL databases, MogDB ensures a seamless integration process, allowing you to leverage the advanced capabilities and performance enhancements provided by MogDB.
The compatibility features of MogDB not only enable smooth transitions and integrations but also ensure that your existing applications continue to function seamlessly with minimal changes required. This level of compatibility reduces the effort and time required for migration or integration projects, allowing you to focus on other critical aspects of your business.
With its comprehensive set of compatibility features, MogDB provides a robust solution that meets the diverse needs of different industries and applications. Whether you are working with complex SQL queries, migrating from Oracle databases, or integrating with MySQL infrastructure, MogDB offers the flexibility and reliability needed to ensure a successful deployment.
AI Capabilities
MogDB stands out among other distributed relational database management systems due to its advanced AI capabilities. These capabilities empower organizations to leverage the power of artificial intelligence for autonomous database operations, database-driven AI, and improved performance through the ABO optimizer.
AI4DB for Autonomous Database Operations
With MogDB’s AI4DB feature, organizations can enhance their operational efficiency by automating various database tasks. This includes automated performance tuning, query optimization, and workload management. The AI algorithms embedded within MogDB continuously monitor the system’s performance metrics and automatically adjust configurations to optimize resource allocation and improve overall database performance.
AI4DB also plays a crucial role in self-healing mechanisms. It can detect anomalies or potential issues within the database environment and take proactive measures to resolve them before they impact critical business operations. By leveraging machine learning algorithms, MogDB can identify patterns in historical data and predict potential failures or bottlenecks, allowing administrators to take preventive actions.
Furthermore, AI4DB enables intelligent data compression techniques that optimize storage utilization without compromising query performance. By analyzing data access patterns and applying advanced compression algorithms, MogDB reduces storage costs while ensuring fast data retrieval.
DB4AI for Database-Driven AI
MogDB’s DB4AI feature allows organizations to seamlessly integrate their databases with artificial intelligence applications. This empowers businesses to unlock valuable insights from their vast amounts of structured and unstructured data.
By providing native support for popular machine learning frameworks such as TensorFlow and PyTorch, MogDB simplifies the process of training and deploying AI models directly within the database environment. This eliminates the need for complex data pipelines or costly data transfers between different systems.
With DB4AI, organizations can leverage the full potential of their databases by performing real-time analytics on large volumes of data. They can train predictive models using historical data stored in MogDB and make accurate predictions based on real-time information ingested into the database. This enables businesses to make data-driven decisions faster and gain a competitive edge in today’s fast-paced market.
ABO Optimizer for Improved Performance
MogDB’s AI capabilities extend to its query optimization engine through the Adaptive Bitwise Optimization (ABO) optimizer. This innovative feature leverages machine learning techniques to intelligently optimize query execution plans based on historical performance data.
The ABO optimizer continuously analyzes query patterns, execution statistics, and system resources to identify optimal query plans. By learning from past experiences, it can adaptively adjust execution strategies to improve overall query performance. This results in faster response times and more efficient resource utilization.
Furthermore, the ABO optimizer reduces the need for manual tuning by automatically selecting the most appropriate join methods, access paths, and index usage based on the characteristics of each query. This simplifies database administration tasks and allows administrators to focus on higher-level optimizations rather than fine-tuning individual queries.
Conclusion
The key features of MogDB make it a powerful and versatile option for database administrators, developers, and IT professionals. Its high performance capabilities, such as the CBO optimizer, vectorized engine, adaptive compression, and parallel query optimization, ensure that users can process large amounts of data quickly and efficiently. This is crucial in today’s fast-paced business environment where time is of the essence.
Furthermore, MogDB offers high availability features that guarantee uninterrupted access to critical data. The master-slave replication, logical replication, physical backup, and delayed replay functionalities ensure that data is always accessible even in the event of system failures or disasters. This level of reliability instills confidence in users and provides peace of mind knowing that their data is safe.
Maintainability is another key aspect of MogDB. With features like grey upgrade, slow SQL diagnosis, system KPI diagnosis, and fault diagnosis tools, administrators can easily identify and resolve issues within the database system. This streamlines maintenance processes and minimizes downtime for businesses.
Compatibility with various SQL features as well as Oracle and MySQL compatibility allows for seamless integration with existing systems and applications. This eliminates the need for extensive modifications or rewrites when migrating from other database management systems to MogDB.
In addition to these impressive features, MogDB also offers AI capabilities through AI4DB for autonomous database operations and DB4AI for database-driven AI. These advanced capabilities enable users to leverage artificial intelligence technologies within their databases to enhance performance and gain valuable insights from their data.
Overall, MogDB stands out as a highly performant, highly available, easy-to-use distributed relational database management system with a wide range of features tailored to meet the needs of modern businesses. Its compatibility with existing systems and applications combined with its AI capabilities make it an attractive choice for organizations across industries. Whether you are a database administrator looking for improved performance or a developer seeking seamless integration options, MogDB has you covered. Trust in MogDB to unlock the power of your data.