What is ASH?
ASH, or Active Session History, is a feature in Oracle databases that records information about active sessions at regular intervals in both the database memory and persistent system tables. Data in memory is cleared after a database restart, but data in the persistent system tables is retained for a longer period. ASH is extremely useful for diagnosing issues when the database encounters problems or performance issues by allowing retrospective analysis to identify the root cause.
In MogDB, a similar ASH capability is implemented.
ASH Capability in MogDB
The ASH capability in MogDB is divided into two parts: the open-source community version (openGauss) and the enhanced enterprise version.
1. openGauss Community Version:
MogDB inherits the ASH capability from openGauss. The database provides two main views: dbe_perf.LOCAL_ACTIVE_SESSION and GS_ASP. The LOCAL_ACTIVE_SESSION view is an in-memory table, while GS_ASP is a persistent table. These views contain sampling information about current active sessions.
Key parameters affecting ASH functionality:
- enable_asp: Set to
onoroffto enable or disable ASH functionality. Default ison. - asp_sample_interval: Specifies the interval between each sample. Default is 1 second. To reduce sampling pressure, this can be set to a longer interval, up to a maximum of 10 seconds.
- asp_sample_num: Specifies the total number of samples retained in the
LOCAL_ACTIVE_SESSIONin-memory table. Exceeding this number triggers a flush of in-memory samples to theGS_ASPsystem table and clears the in-memory table. Default is 100,000 samples. - asp_flush_rate: Determines which in-memory samples are flushed to the
GS_ASPtable. Samples withsampleid % asp_flush_rate == 0are marked asneed_flush_sample=trueand are persisted. Default is 10, meaning 1/10 of samples are persisted. - asp_retention_days: Specifies the retention period for data in the
GS_ASPtable. Default is 2 days, with a maximum of 7 days.
2. MogDB Enterprise Version:
The enterprise version enhances ASH capability, termed “SQL Execution State Observation,” by adding sampling of SQL execution operators. The plan_node_id field is added to views to record the execution operator during each sample, allowing identification of which step in the execution plan is causing performance issues.
Key parameters affecting enterprise ASH functionality:
- resource_track_level: Set to
operatorto enable operator sampling capability. Default isquery, which records only SQL-level sampling.
LOCAL_ACTIVE_SESSION View
This view records extensive information, including session ID, wait events, and SQL query ID (which can be linked to dbe_perf.statement_history or dbe_perf.statement_complex_runtime to retrieve SQL text and execution plans).
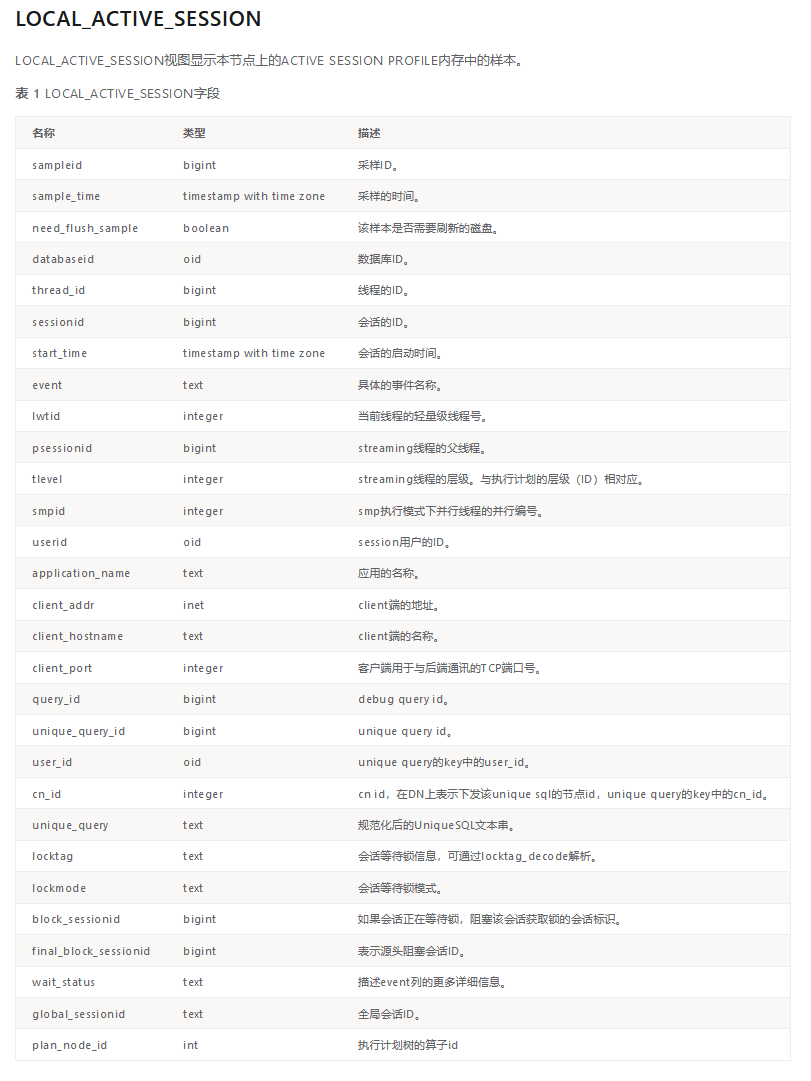
Note: The plan_node_id field exists only in the enterprise version.
Recording SQL Execution Plans
Querying the execution plans of past or currently executing SQL is a common requirement in database maintenance. In MogDB, the following views record SQL execution plans:
- dbe_perf.STATEMENT_HISTORY: Records information about completed SQL, including execution plans (
query_planfield). - dbe_perf.STATEMENT_COMPLEX_RUNTIME: Records information about currently executing SQL, including execution plans (
query_planfield).
Parameters affecting recording of SQL execution plans:
- enable_resource_track: Enables or disables resource tracking. Default is
on. If set tooff, no user SQL execution information, including execution plans, is tracked. - resource_track_cost: Sets the minimum execution cost for SQL statements to be tracked. Only SQL with a cost above this value will have its execution plan recorded.
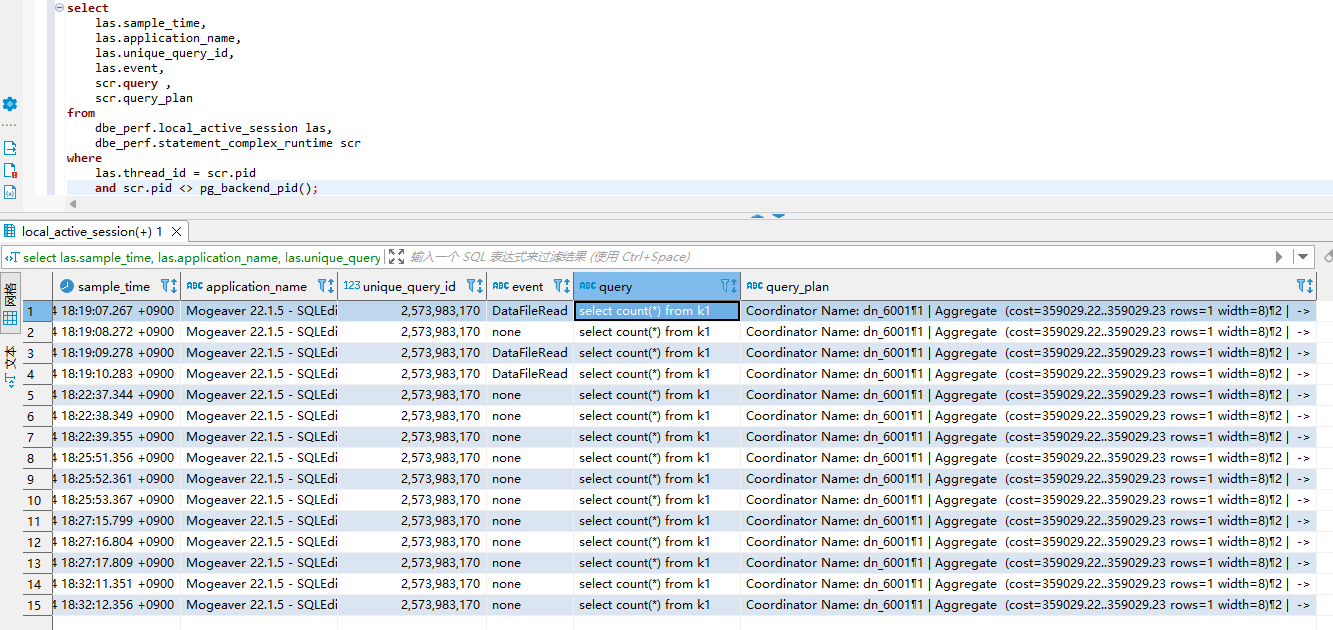
Comprehensive Query Example
The following query retrieves all information about ongoing SQL executions, including historical samples:
1 | SELECT las.sample_time, las.application_name, las.unique_query_id, las.event, scr.query, scr.query_plan |
Example output shows a frequently executed full table scan query, including SQL text, execution plan, and client information, providing valuable data for performance diagnosis.