Kamus
2024-05-27

How to Find ...

Diagnostic Needs

When the MogDB database consumes a significant amount of system resources, such as nearly 100% CPU usage, how can we determine which session(s) in the database are using these resources?

In Oracle databases, diagnosing such issues typically involves associating v$session, v$process, and the OS process ID found using the top or ps commands. However, MogDB uses a thread model, and only one process ID is visible at the OS level. So, how do we pinpoint the problem?

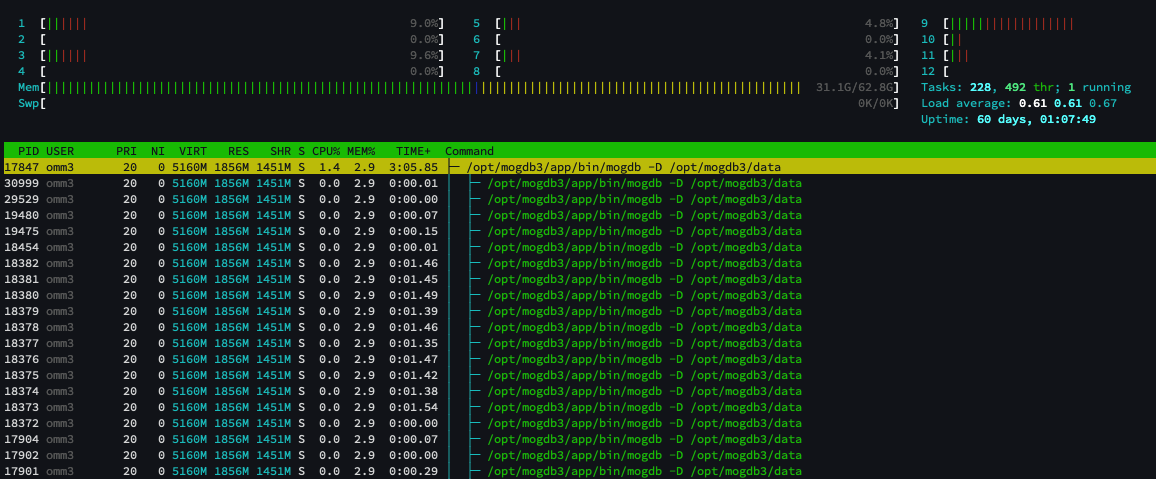
Since MogDB uses a thread model, unlike PostgreSQL’s process model, checking network port access with the lsof command at the OS level will show multiple user sessions connected, but only the process ID will be displayed in the PID column, not the thread.

1
2
3
4
5
6
7
8
9
10
$ lsof -i 4 -a -p `pgrep -u omm3 mogdb`
COMMAND PID USER FD TYPE DEVICE SIZE/OFF NODE NAME
mogdb 12027 omm3 8u IPv4 20313752 0t0 TCP *:biimenu (LISTEN)
mogdb 12027 omm3 9u IPv4 20313753 0t0 TCP *:18001 (LISTEN)
mogdb 12027 omm3 325u IPv4 28320946 0t0 TCP mogdb-kernel-0004:biimenu->softbank060132034173.bbtec.net:45206 (ESTABLISHED)
mogdb 12027 omm3 330u IPv4 28316174 0t0 TCP mogdb-kernel-0004:biimenu->softbank060132034173.bbtec.net:45208 (ESTABLISHED)
mogdb 12027 omm3 336u IPv4 28302815 0t0 TCP mogdb-kernel-0004:biimenu->softbank060132034173.bbtec.net:45210 (ESTABLISHED)
mogdb 12027 omm3 340u IPv4 28323140 0t0 TCP mogdb-kernel-0004:biimenu->softbank060132034173.bbtec.net:45212 (ESTABLISHED)
mogdb 12027 omm3 360u IPv4 28323141 0t0 TCP mogdb-kernel-0004:biimenu->softbank060132034173.bbtec.net:45214 (ESTABLISHED)
mogdb 12027 omm3 375u IPv4 28305050 0t0 TCP mogdb-kernel-0004:biimenu->softbank060132034173.bbtec.net:45216 (ESTABLISHED)

How to Get Thread ID

You can use htop. After opening htop, press F5 to display the process tree. The first PID is the process ID, and each line under the tree structure shows the corresponding thread ID for that process.

img

You can also use the ps command. The -L parameter displays threads, and the -o parameter specifies the columns of interest.

1
2
3
4
5
6
7
8
9
10
11
12
13
14
15
16
17
18
19
20
21
22
23
24
25
26
27
28
29
30
31
32
33
34
35
36
37
38
39
40
41
42
43
44
45
46
# ps -Lp `pgrep -u omm3 mogdb` -o %cpu,tid,pid,ppid,cmd,comm
%CPU TID PID PPID CMD COMMAND
0.0 17847 17847 1 /opt/mogdb3/app/bin/mogdb - mogdb
0.0 17848 17847 1 /opt/mogdb3/app/bin/mogdb - jemalloc_bg_thd
0.0 17854 17847 1 /opt/mogdb3/app/bin/mogdb - mogdb
0.0 17855 17847 1 /opt/mogdb3/app/bin/mogdb - syslogger
0.0 17856 17847 1 /opt/mogdb3/app/bin/mogdb - reaper
0.0 17857 17847 1 /opt/mogdb3/app/bin/mogdb - jemalloc_bg_thd
0.0 17858 17847 1 /opt/mogdb3/app/bin/mogdb - jemalloc_bg_thd
0.0 17860 17847 1 /opt/mogdb3/app/bin/mogdb - jemalloc_bg_thd
0.0 17884 17847 1 /opt/mogdb3/app/bin/mogdb - checkpointer
0.0 17885 17847 1 /opt/mogdb3/app/bin/mogdb - Spbgwriter
0.1 17886 17847 1 /opt/mogdb3/app/bin/mogdb - pagewriter
0.0 17887 17847 1 /opt/mogdb3/app/bin/mogdb - pagewriter
0.0 17888 17847 1 /opt/mogdb3/app/bin/mogdb - pagewriter
0.0 17889 17847 1 /opt/mogdb3/app/bin/mogdb - pagewriter
0.0 17890 17847 1 /opt/mogdb3/app/bin/mogdb - pagewriter
0.8 17891 17847 1 /opt/mogdb3/app/bin/mogdb - WALwriter
0.0 17892 17847 1 /opt/mogdb3/app/bin/mogdb - WALwriteraux
0.0 17893 17847 1 /opt/mogdb3/app/bin/mogdb - AVClauncher
0.0 17894 17847 1 /opt/mogdb3/app/bin/mogdb - Jobscheduler
0.0 17895 17847 1 /opt/mogdb3/app/bin/mogdb - asyncundolaunch
0.0 17896 17847 1 /opt/mogdb3/app/bin/mogdb - globalstats
0.0 17897 17847 1 /opt/mogdb3/app/bin/mogdb - applylauncher
0.0 17898 17847 1 /opt/mogdb3/app/bin/mogdb - statscollector
0.0 17899 17847 1 /opt/mogdb3/app/bin/mogdb - snapshotworker
0.1 17900 17847 1 /opt/mogdb3/app/bin/mogdb - TrackStmtWorker
0.0 17901 17847 1 /opt/mogdb3/app/bin/mogdb - 2pccleaner
0.0 17902 17847 1 /opt/mogdb3/app/bin/mogdb - faultmonitor
0.0 17904 17847 1 /opt/mogdb3/app/bin/mogdb - undorecycler
0.0 18372 17847 1 /opt/mogdb3/app/bin/mogdb - worker
0.0 18373 17847 1 /opt/mogdb3/app/bin/mogdb - worker
0.0 18374 17847 1 /opt/mogdb3/app/bin/mogdb - worker
0.0 18375 17847 1 /opt/mogdb3/app/bin/mogdb - worker
0.0 18376 17847 1 /opt/mogdb3/app/bin/mogdb - worker
0.0 18377 17847 1 /opt/mogdb3/app/bin/mogdb - worker
0.0 18378 17847 1 /opt/mogdb3/app/bin/mogdb - worker
0.0 18379 17847 1 /opt/mogdb3/app/bin/mogdb - worker
0.0 18380 17847 1 /opt/mogdb3/app/bin/mogdb - worker
0.0 18381 17847 1 /opt/mogdb3/app/bin/mogdb - worker
0.0 18382 17847 1 /opt/mogdb3/app/bin/mogdb - worker
0.0 18454 17847 1 /opt/mogdb3/app/bin/mogdb - worker
0.0 19475 17847 1 /opt/mogdb3/app/bin/mogdb - worker
0.0 19480 17847 1 /opt/mogdb3/app/bin/mogdb - worker
0.0 29529 17847 1 /opt/mogdb3/app/bin/mogdb - worker
0.0 30999 17847 1 /opt/mogdb3/app/bin/mogdb - worker

The rows in the comm column that display as “worker” are backend processes of user sessions in the database. Typically, user sessions that consume high CPU can be filtered to show only user sessions using the grep command.

How to Map OS Thread ID to Database Session

Suppose on this server, the thread with ID 18372 is consuming a lot of CPU. In MogDB, you can query the pg_os_threads view to find the session ID corresponding to this thread.

1
2
3
4
5
6
MogDB=# select * from pg_os_threads where lwpid=18372;

node_name | pid | lwpid | thread_name | creation_time
----------+------------------+-------+-------------+------------------------------
dn_6001 | 140545137571584 | 18372 | dn_6001 | 2022-05-30 19:54:42.459129+08
(1 row)

The pg_os_threads view records the relationship between lightweight thread IDs and session IDs. The lwpid column is the OS thread ID, and the pid column is the database session ID. For detailed information, refer to the MogDB documentation on PG_OS_THREADS.

If you have monadmin privileges, you can also query the os_threads view in the dbe_perf schema, which provides the same information.

After finding the database session ID, you can perform various actions, such as querying the dbe_perf.session_stat_activity view to get the application name, client IP address, and the SQL query being executed by that session.

1
2
3
4
5
6
MogDB=# select application_name, client_addr, query from dbe_perf.session_stat_activity where pid=140545137571584;

application_name | client_addr | query
-----------------+-------------+---------------------------------------------
dn_6001 | 172.16.0.176| SELECT cfg_value FROM bmsql_config WHERE cfg_name = $1
(1 row)

You can also query the dbe_perf.thread_wait_status view to get the current wait event of the session. Note that this view contains the lwtid field, which directly corresponds to the thread ID.

1
2
3
4
5
6
MogDB=# select lwtid, wait_status, wait_event from dbe_perf.thread_wait_status where sessionid=140545137571584;

lwtid | wait_status | wait_event
------+-------------+-----------
18372 | wait cmd | wait cmd
(1 row)